COMPYDA - Compare Your Biomedical Image Data
Introduction
Compyda is a free web-based tool for statistically comparing the characteristics of two image datasets. The tool was initially designed to verify the realism of generated biomedical image data, although its potential use is much broader. Augmented image data is essential in medical and biomedical image analysis algorithms. However, the usage of such data strongly relies on their quality and plausibility. Despite the emergence of many image synthesis frameworks in recent years, the quality control of the generated images is still overlooked in many cases. If we want to use augmented image data, we should be aware of two critical aspects:
- the augmented data should resemble the original (typically the real) ones as much as possible, with evidence of their similarity
- the augmented data should cover the whole variability of the original (real) data
 [
[ ](https://cbia.fi.muni.cz/compyda/)
This integrated interactive guide helps to check the two aforementioned requirements step by step. After uploading two datasets (the original and the augmented one), the user is provided with the results of univariate analysis. In the case of static data analysis, it is also possible to browse the results of multivariate analysis afterwards. Finally, the user can download all the results, including plots, statistics and derived computations.
According to the type of uploaded image data, Compyda provides you with the computation of characteristic descriptors:
- Grayscale images → Harralick texture descriptors
- Binary images → Shape descriptors
Other descriptors can also be processed in the analysis, but precomputation from the user’s side is necessary.
Methods
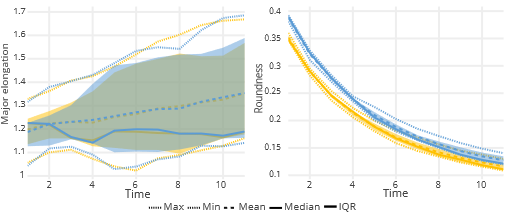
The first part of the analysis focuses on inspecting each descriptor separately – univariately. The analysis compares the distribution of a selected descriptor across the dataset. In the case of static data analysis, one can have a complex view of distribution comparison through interactive plots (including quantile-quantile plots, histograms, boxplots), descriptive analysis and Kolmogorov-Smirnov Test. The analysis of time-lapse sequences is also based on the distribution comparison. The plot shows the basic descriptive statistics (such as min, max, mean, median value and interquartile range (IQR)) for each timepoint/frame of the sequence for each descriptor. The corresponding statistics are connected in time. In case of notable similarity, the IQR ranges overlap in most of their area, and the mean/median curves will have a similar shape and position.
Univariate analysis can reveal dissimilarities in particular descriptors; however, it cannot capture the overall multivariate distribution of data points and identify possible outliers in a multidimensional space.
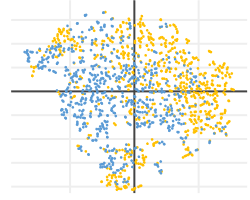
In our tool, two methods of multivariate comparison are implemented: t-distributed stochastic neighbor embedding (t-SNE) and principal component analysis (PCA). The output of both methods is easily interpretable in 2D or 3D plots. Currently, multivariate analysis is available for static data only.
Features
- Online – web-hosted tool. No software installation or programming language knowledge is required.
- Easy to use
- Adaptable to specific use cases
- Free download of outputs and derived results in ready-to-print image files (PNG, PDF, SVG)
- Demo files for tool testing
- Interactive plots with image previews
- No requirements for image and folder names
- Ensures data policy and confidentiality
- Random sampling from datasets
- Outlier detection with a preview
- Time-lapse analysis
Terms of use
The usage of Compyda web-interface is endorsed for scientific and educational purposes. The usage for any other purpose (e.g. commercial) is generally possible, but solely with the explicit permission of the authors. All the results are free of charge and may be used as long as the Compyda web-interface is properly acknowledged by using the quotation of this form (may be modified only formally for the needs of individual publication purposes):
The tables/plots were created using Compyda web service[*] (https://cbia.fi.muni.cz/compyda).
[*] Nečasová T, Múčka D a Svoboda D. COMPYDA: An online tool for verifying the similarity of image datasets. In 2024 IEEE International Symposium on Biomedical Imaging (ISBI). Athens, Greece: IEEE, 2024, 5 pages, ISBN 979-8-3503-1334-5.
Acknowledgement
We acknowledge the support of the Ministry of Education, Youth and Sports of the Czech Republic (MEYS CR) (Czech-BioImaging Projects LM2023050 and CZ.02.1.01/0.0/0.0/18_046/0016045).
Credits
- Tereza Nečasová (coordinator, statistical analysis, software development)
- Daniel Múčka (web admin and development, software development)
- David Svoboda (supervision, image processing)
Contact
If you encounter any failure or if you would like to contact developers, please write an email to cbia-compyda@fi.muni.cz.