TEM ExosomeAnalyzer
TEM ExosomeAnalyzer is a program for automatic and semi-automatic detection of extracellular vesicles (EVs), such as exosomes, or similar objects in 2D images from transmission electron microscopy (TEM). The program detects the EVs, finds their boundaries, and reports information about their size and shape.
This software has been developed in terms of project MUNI/M/1050/2013 and supported by Grant Agency of Masaryk University.
Introduction
Detecting EVs in 2D transmission electron microscopy images and measuring their properties can be a taxing task, if performed manually. To make an automated analysis possible, we have developed this software tool.
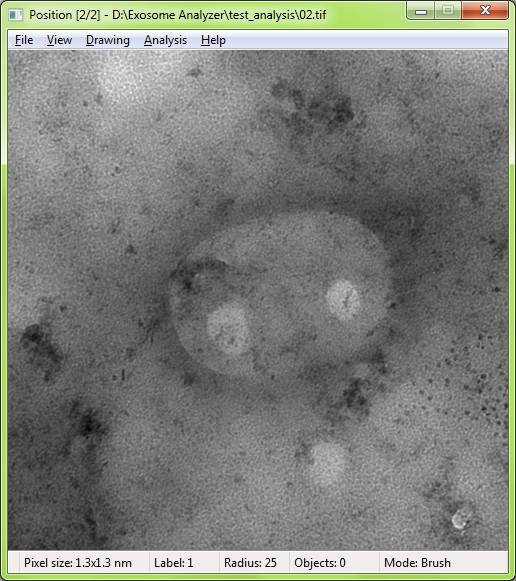
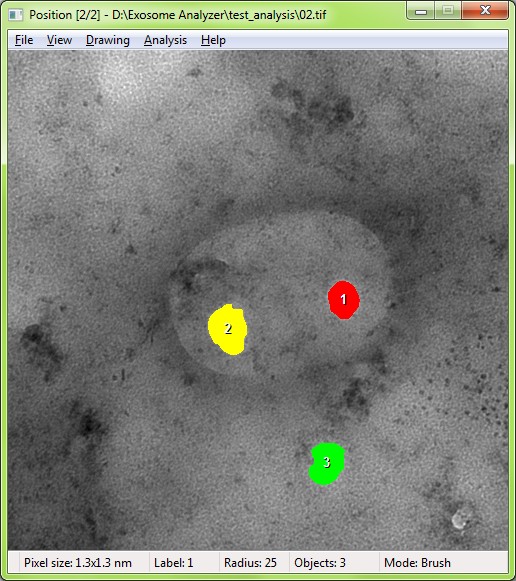
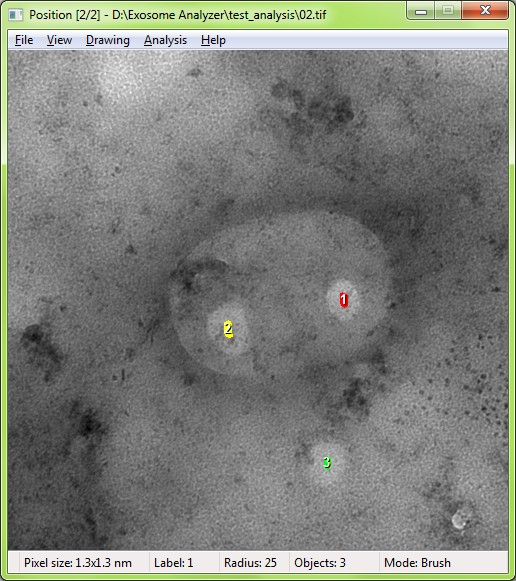
The EVs are detected based on the shape and edge contrast criteria. The exact shapes of the EVs are then segmented using a watershed-based approach.
With proper parameter settings, even images with EVs both lighter and darked than the background, or containing artifacts or precipitated stain can be processed. If the fully-automatic processing fails to produce the correct results, the program can be used semi-automatically, letting the user adjust the detection seeds during the intermediate steps, or even draw the whole segmentation manually.
Using the Analyzer
Common Workflow
-
Click
File/Open images…(Ctrl+O) to open the images to be analyzed.Multiple image files showing different positions within the microscopic sample can be selected. The analyzer supports .tif image files containing either floating point or 16-bit integer greyscale data. In the metadata of each image, the resolution must be specified in terms of micrometers per pixel (common values being for example 0.001 micrometers per pixel). This can be done e.g. with ImageJ/FIJI software, by selecting
Image/Properties..., filling in the unit as "um", specifying pixel width and height, and saving the image. If your images are RGB, contain transparency channel, or no spatial resolution data, you may need to convert them first. Images in one batch do not have to be the same size (for performance reasons, around 500×500 pixels is ideal). -
Click
Analysis/Detect exosomes (current position)(Ctrl+D) to start the detection for the current image (position within the microscopic sample). Alternatively, you can start the detection for all open images (Ctrl+Shift+D, rewriting old detection results), or for all open images that have not been analyzed yet and whose results are empty (Ctrl+Alt+D).If necessary, you can adjust the parameters of the detection algorithm by clicking
Analysis/Parameters…(Ctrl+P) (see Parameters for details).This finds the seeds for the EV segmentation: a small area should be detected inside each EV. If some EV is missed, or if a seed is detected outside an EV, the seeds can be manually modified, created, or deleted (see Manual Editing).
-
Click
Analysis/Segment exosomes (current position)(Ctrl+R) to automatically find the boundaries of the EVs marked by the seeds in the current image. Alternatively, you can start the detection for all open images (Ctrl+Shift+R).
-
If the detected EV boundaries appear to be incorrect, the results can be modified manually, just like the seeds in the detection step.
-
Click
File/Export quantitative results…(Ctrl+E) to save a tab-delimited text file with the analysis results for all images.The first line of the file contains the header, and each of the following lines contains information about one EV:
- name of the image file it was detected in
- label of the EV
- diameter (in nanometers)
roundness
<p>(Calculated as <em>(4 · π · Area) / (Perimeter<sup>2</sup>)</em>. Roundness of 1.0 corresponds to an ideal circle. For non-circular shapes, the value is lower.)</p></li>
<li>perimeter (in nanometers)</li>
<li>area (in nanometers<sup>2</sup>)</li>
</ul>
You can also save the resulting images directly (e.g. for further analysis) by clicking
File/Export image results(Ctrl+I). The files will be saved with the "export_" prefix, next to the input images.The segmentation itself can be saved and loaded from the menu, or with Ctrl+S and Ctrl+L.
Parameters
Using the Analysis/Parameters… (Ctrl+P) command, you can adjust some of the detection and segmentation parameters:
Edge contrast (lambda): The contrast parameter λ of the edge-enhancing diffusion. (default: 0.005)Area fraction (alpha): Lowering this parameter towards 0.0 means only smoother, rounder EV seeds will be accepted. Increasing this parameter towards 1.0 allows even for non-smooth, non-round seeds. (default: 0.15)Roundness threshold: EV seeds whose roundness is lower than this are rejected. (default: 0.75; value of 1.0 requires perfect circles)Maximum relative cluster size: If your images contain large clusters of touching EVs, increasing this multiplier above 1.0 can prevent the large clusters from being rejected, splitting them instead into several seeds. (default: 1.0; value of 2.0 allows clusters twice as large)Relative size of expected EVs: The algorithm aims to detect EVs whose size ranges from approximately 30 to 200 nm. If you want to detect vesicles of a different size, you can use this scaling multiplier. (default: 1.0; value of 2.0 detects objects twice as large)Minimum object diameter (in um): This specifies the minimum allowed size for the final objects (for circular objects, it is exactly the diameter; for non-circular objects, it is a corresponding measurement).
If the intermediate results after the automatic detection do not contain seeds for all EVs, or contain erroneously detected seeds, the seeds can be added, removed, or modified manually. The same procedure can also be used after the segmentation step, in order to correct the final results.
Editing the results works like painting in a graphics editor. Three basic editing tools/modes are available:
- “Brush”: This is the default editing mode. Paint the results by holding down the
left mouse buttonand dragging the cursor over the area you want to paint. The size of the brush is visually indicated, and can be changed usingF3andF4. - “Contour”: You can switch between the Contour and the Brush modes using the menu, or by pressing
C(the current mode is indicated in the status bar at the bottom of the window). In the Contour mode, you can draw a pixel-precise contour of an EV by holding down theleft mouse buttonand dragging the cursor over the image. After releasing the mouse button, the area is closed and painted with the currently selected label. - “Paint bucket”: You can place the cursor over an image area and press
R. The connected area will be immediately filled/repainted using the currently selected label (if the current label is empty and you pressRwhile pointing at a non-empty area, the area will be erased).
In all three cases, editing is done with a currently selected label (“brush color”). Pixels labeled with the same label are considered parts of the same object (even if not connected), so each individual EV should have a unique label. The current label can be selected using F1 and F2. In order to erase a portion of the detection/segmentation results, press E to select an empty label. To select a new, unused label, press U: this will make sure anything you draw with it will be considered a new EV.
To select a label already present in the image (“eyedropper” tool), press right mouse button while pointing at an image area (when pointing at an empty area, an empty label will be selected). The current label is indicated in the status bar at the bottom of the window, so right-clicking the image can also be used to directly inspect the labels of individual EVs/pixels.
One “undo” level is available, and can be used by pressing backspace.
Navigating between images
If multiple images are open and you want to process them individually, you can use the following keys to move between them:
Page Up: previous image.Page Down: next image.Home: first image.End: last image.
Adjusting the display
You can zoom in and out using + and - keys, or using the mouse wheel. If the current image is larger than the window, you can scroll the visible area using the scrollbars, or the arrow keys.
By using the following commands, you can adjust how the intermediate seeds and final results are displayed:
View/Label numbersorF5: toggle the numbers of EVs on/off.View/Only raw image dataorF6: toggle displaying the results on/off.View/Only contoursorF7: switch between displaying EVs as filled, or only outlined.
Algorithm
Detecting EVs in TEM images is challenging, especially because of the wide variability in EV size (ranging roughly from 30 to 200 nanometers), and their appearance. In some images, the intensity of the EVs is higher than that of the background, while in others, it may be comparable or lower.
To process such images, we designed an algorithm working in two main stages: first, the algorithm detects the initial EV seeds in the image, and then it segments the EVs using the seeded watershed transform.
Seed Detection — Gradual Edge Growing
The reliable detection of the EV seeds is the critical part of the algorithm. It starts with preprocessing the image with edge-enhancing diffusion (EED), with 100 iterations, time step of 0.1, and a user-specified contrast parameter λ. This reduces the amount of noise, and enhances the EV borders. From this preprocessed image, we obtain a gradient magnitude image, with intensities mapped to the [0, 1] interval.
Because the gradient magnitude along the EV border can vary significantly, we perform a gradual edge growing routine based on a sequence of hysteresis thresholdings, which identifies the candidate borders. The routine sets the upper threshold to the top 2 % of the cumulative histogram, and the lower threshold is set to progressively lower values in a sequence of steps. In each step, a hysteresis thresholdig more “benevolent” than the previous one is performed, letting the thresholded edge component gradually grow.
Every time the growing edge fully encloses a continuous interior component, that component is labeled as a candidate EV seed, and the corresponding edge component is frozen (i.e. prevented from growing in further thresholdings), in order to prevent the edge from growing further and possibly distorting or removing the candidate seeds.
However, this freezing might preclude the detection of some EVs in situations in which two or more EVs are touching. To prevent that, we compute the skeleton of the edge component at the time of freezing, and if it contains any long branches (exceeding approx. 5 % of the expected EV circumference), the tips of those branches are kept unfrozen. This allows them to grow further along the underlying gradient magnitude ridges, potentially enclosing another, neighboring EV. This is illustrated in Fig. 1:
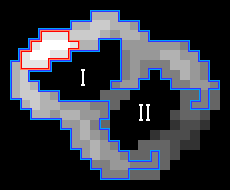
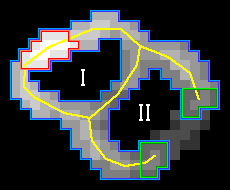
Fig. 1: Two successive iterations of the edge growing procedure. During this step, the component labeled I gets fully enclosed by the growing edge, and the edge gets frozen (with the exception of the tips of the branches). Component II will be enclosed later, as the lower threshold progressively decreases. Red: area corresponding to the highest threshold. Blue: area corresponding to the current threshold. Yellow: edge skeleton. Green: Tips of the long skeleton branches.
Seed Detection — Filtering
After the hysteresis thresholdings are computed and the candidate EV seeds are identified, they are filtered based on their size and shape. First, the candidate seeds outside the allowed size range are discarded. Following that, we perform a morphological opening with a disc-shaped structuring element whose size corresponds to a user-specified fraction α of the expected EV size. If this opening reduces the area of the candidate seed by more than 10 %, the seed is discarded due to its boundary not being sufficiently smooth.
Potential clusters of touching EVs are then separated into individual EVs by computing the Euclidean distance transform (EDT), and taking the HCONVEX (h = 3) transform of the result. This isolates the distinct local maxima of the EDT image.
After this, the seeds can either be directly used for the final watershed segmentation, or they can be further refined to improve the detection. During this additional filtering, an auxiliary watershed segmentation based on the seeds is computed. For each component c of the resulting auxiliary segmentation, we compute its roundness Rc as
Rc = (4 π Ac) / (Pc2) ,
where Ac is the component’s area, and Pc its perimeter. If Rc ≤ 0.6, then the component c of the auxiliary segmentation is not considered round, and the seed from which it was created is discarded. This helps in cases where strong background influence causes false detections; these tend to have low roundness, and are therefore removed by this step.
The final segmentation is then performed using morphological watershed, with the gradient magnitude of the input image as the segmentation function. However, the most important step is the detection of the seeds; for the final segmentation, alternatives can be used, such as methods based on energy minimization.
Results
“Fully automatic” refers to running both detection and segmentation with the default parameters, with no user input.
In the “Filtered seeds” run, the user manually removed false detections (one mouse click per seed) before proceeding to the segmentation.
In the “Curated seeds” run, the user manually removed false detections, and added the missing seeds before proceeding to the segmentation.
| Dataset 1 | Fully automatic | Filtered seeds | Curated seeds | |–––––––––––––––––––|:———————:|:––––––––––:|:—————––:| | Precision | 0.4604 | 0.9844 | 0.9262 | | Recall | 0.6214 | 0.6117 | 0.8932 | | F1 score | 0.5289 | 0.7545 | 0.9094 | | Jaccard coefficient | 0.8336 | 0.8382 | 0.8218 |
| Dataset 2 | Fully automatic | Filtered seeds | Curated seeds | |–––––––––––––––––––|:———————:|:––––––––––:|:—————––:| | Precision | 0.4309 | 0.9812 | 0.7925 | | Recall | 0.3770 | 0.3799 | 0.7336 | | F1 score | 0.4022 | 0.5477 | 0.7619 | | Jaccard coefficient | 0.7803 | 0.7826 | 0.7553 |
Download and License
TEM ExosomeAnalyzer (ZIP archive, Windows x64)
Installing Microsoft Visual C++ Redistributable Package 2015 (x64) may be necessary to run the application.
TEM ExosomeAnalyzer is provided free of charge for noncommerical and research purposes. Its use for any other purpose is generally possible, but solely with the explicit permission of the authors. Copyright belongs to the authors below and Centre for Biomedical Image Analysis (CBIA) at Masaryk University.
The software was developed with the financial support of Grant Agency of Masaryk University (Grants No. MUNI/M/1050/2013, MUNI/E/0876/2018), and Czech Science Foundation (Grant No. 16-16508Y).
Software Authors
Martin Maška, Pavel Matula, Jakub Jozef Pálenik, Karel Štěpka
contact: cbia-tem-ea@fi.muni.cz